The final project for the ENGR 498Q Digital Communications course built directly upon our semester labs, where we had progressively constructed a 4-Pulse Amplitude Modulation (4-PAM) system.
For the final project, we were challenged to scale this design into a 16-Symbol Quadrature Amplitude Modulation (16-QAM) system. By modifying and duplicating the core 4-PAM architecture to handle orthogonal In-phase (I) and Quadrature (Q) channels, we successfully implemented the full 16-QAM system.
All labs and simulations were conducted using the GNU Radio software and NI USRP-2901 software defined radios (SDR).
16QAM Communication System in GNU Radio
The goal of 16-QAM system is to maximize data throughput over a limited bandwidth. It achieves this by varying both the amplitude and phase of a carrier signal simultaneously, allowing a single transmitted symbol to represent 4 bits of binary data.
The primary trade-off for this spectral efficiency is noise sensitivity. Because data relies on precise amplitude levels, any signal distortion or noise can push a point into an adjacent grid slot, causing bit errors. Implementing 16-QAM requires highly linear power amplifiers and precise carrier synchronization at the receiver to prevent clipping and phase drift.
Overview
The 16-QAM system uses an NI USRP-2901 SDR to both transmit and recieve our signals using a coaxial cable as our channel. Simulations were also conducted using a virtual channel as well.
Instead of transmit any meaningful data over the channel, a stream of random bits were generated. Various parts of the system were monitored in a GUI to better visualize what each portion is doing.
All processes in this project are occurring in the baseband and imposed on to a 930 MHz carrier at transmission. Below is a figure of the variables and virtual channel configuration.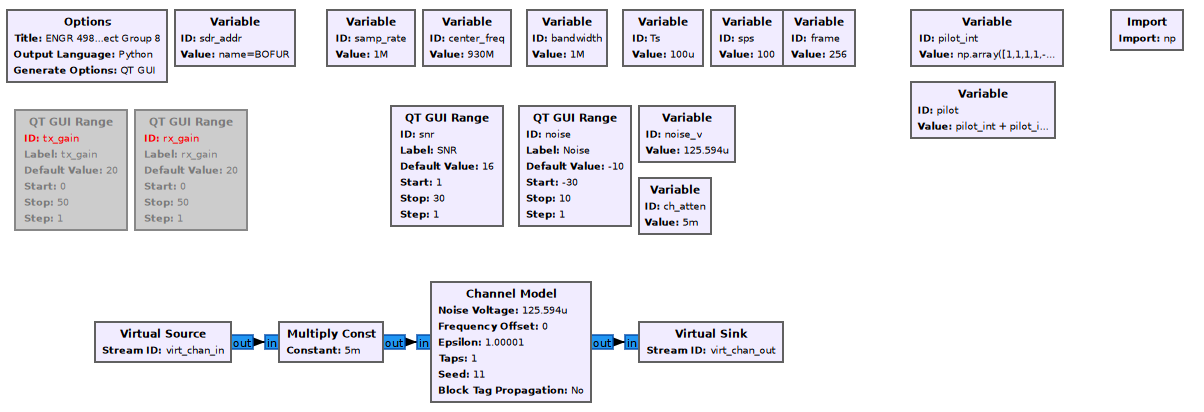
Data Transmition
The transmission portion of the system operates by taking in the raw data as 4-bit symbols. These symbols are assigned quadrature values according to the mapping below.
constellation = [(-3-3j), (-1-3j), (1-3j), (3-3j),
                (-3-1j), (-1-1j), (1-1j), (3-1j),
                (-3+1j), (-1+1j), (1+1j), (3+1j),
                (-3+3j), (-1+3j), (1+3j), (3+3j)]

symbol_map = [0, 4, 12, 8, 1, 5, 13, 9, 3, 7, 15, 11, 2, 6, 14, 10]
After symbol mapping, the signal is routed through a pulse-shaping filter prior to transmission. This process limits harmonic radiation and optimizes the trade-off between bandwidth usage and signal-to-noise ratio (SNR).
The sybols are sent in packets of 128 symbols, with a 32-symbol pilot signal being sent at the beginning of each packet. This pilot signal allows the reciever to syncronize the incoming data to be decoded. This occurs within the virtual source, which generates the random symbols and appends the pilot sequence to the start of it.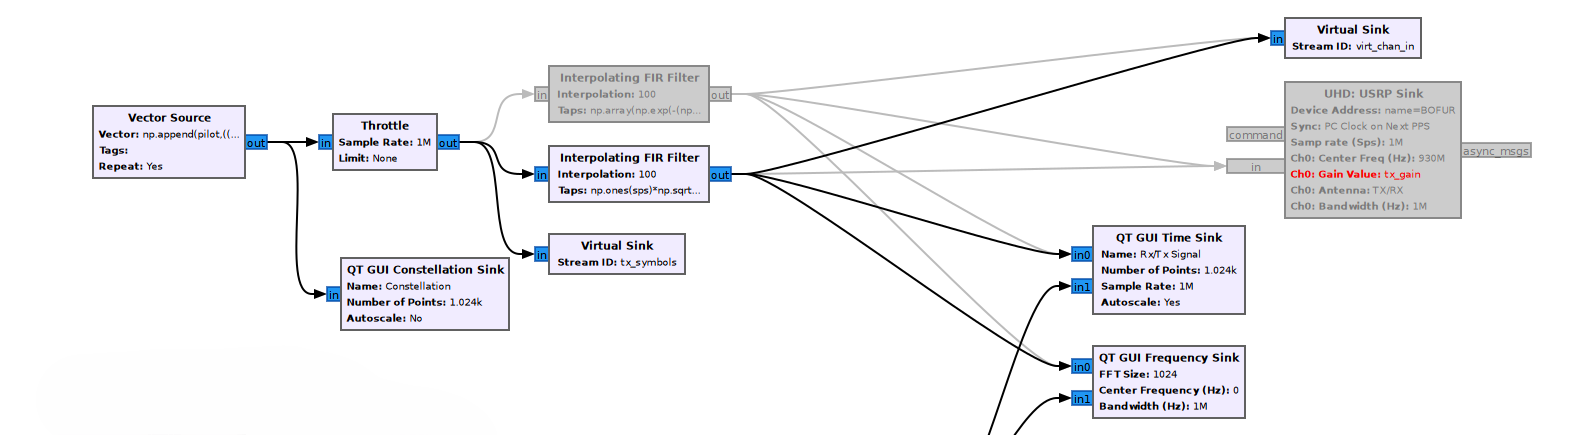
Recieve Syncronization
On the receiving side of the system, the incoming QAM signal is delayed, out of phase, and unsynchronized with the radio's physical local oscillator. To correct this, the signal must pass through a synchronization pipeline.
First, a phase synchronization and equalization block is used to align the real and imaginary (in-phase and quadrature) components. This block functions by correlating the received data with the known 32-symbol pilot signal.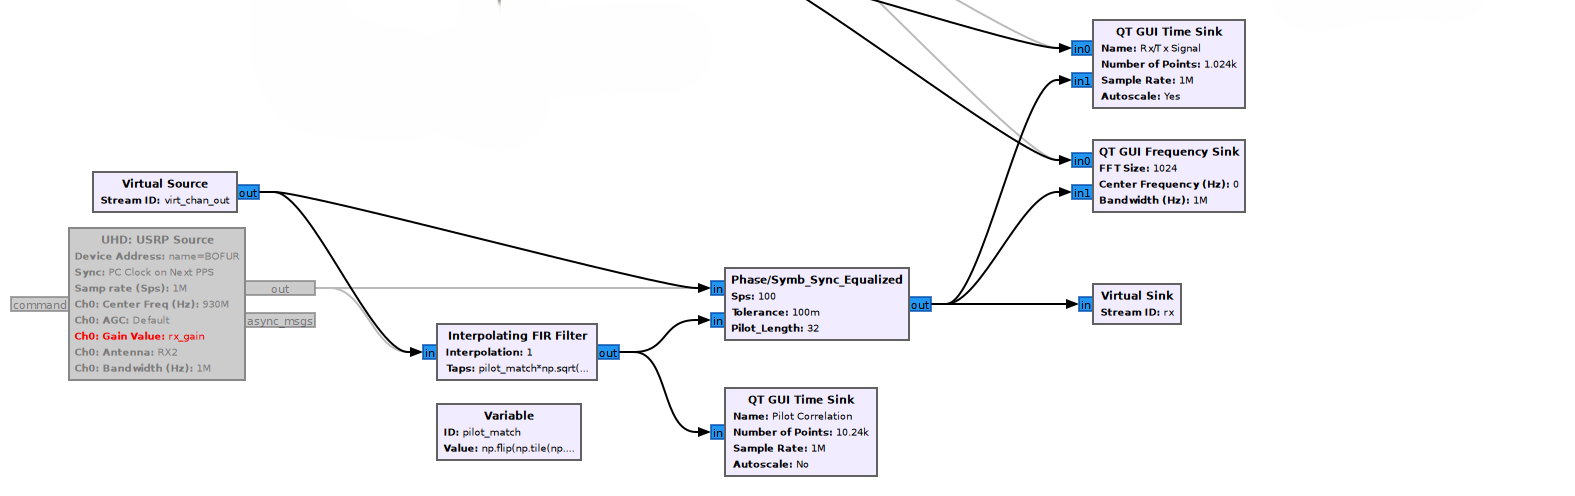
When using Gaussian pulse shaping, the synchronization script encountered difficulties locking onto the signal. The figure below illustrates the typical appearance of this unsynchronized signal.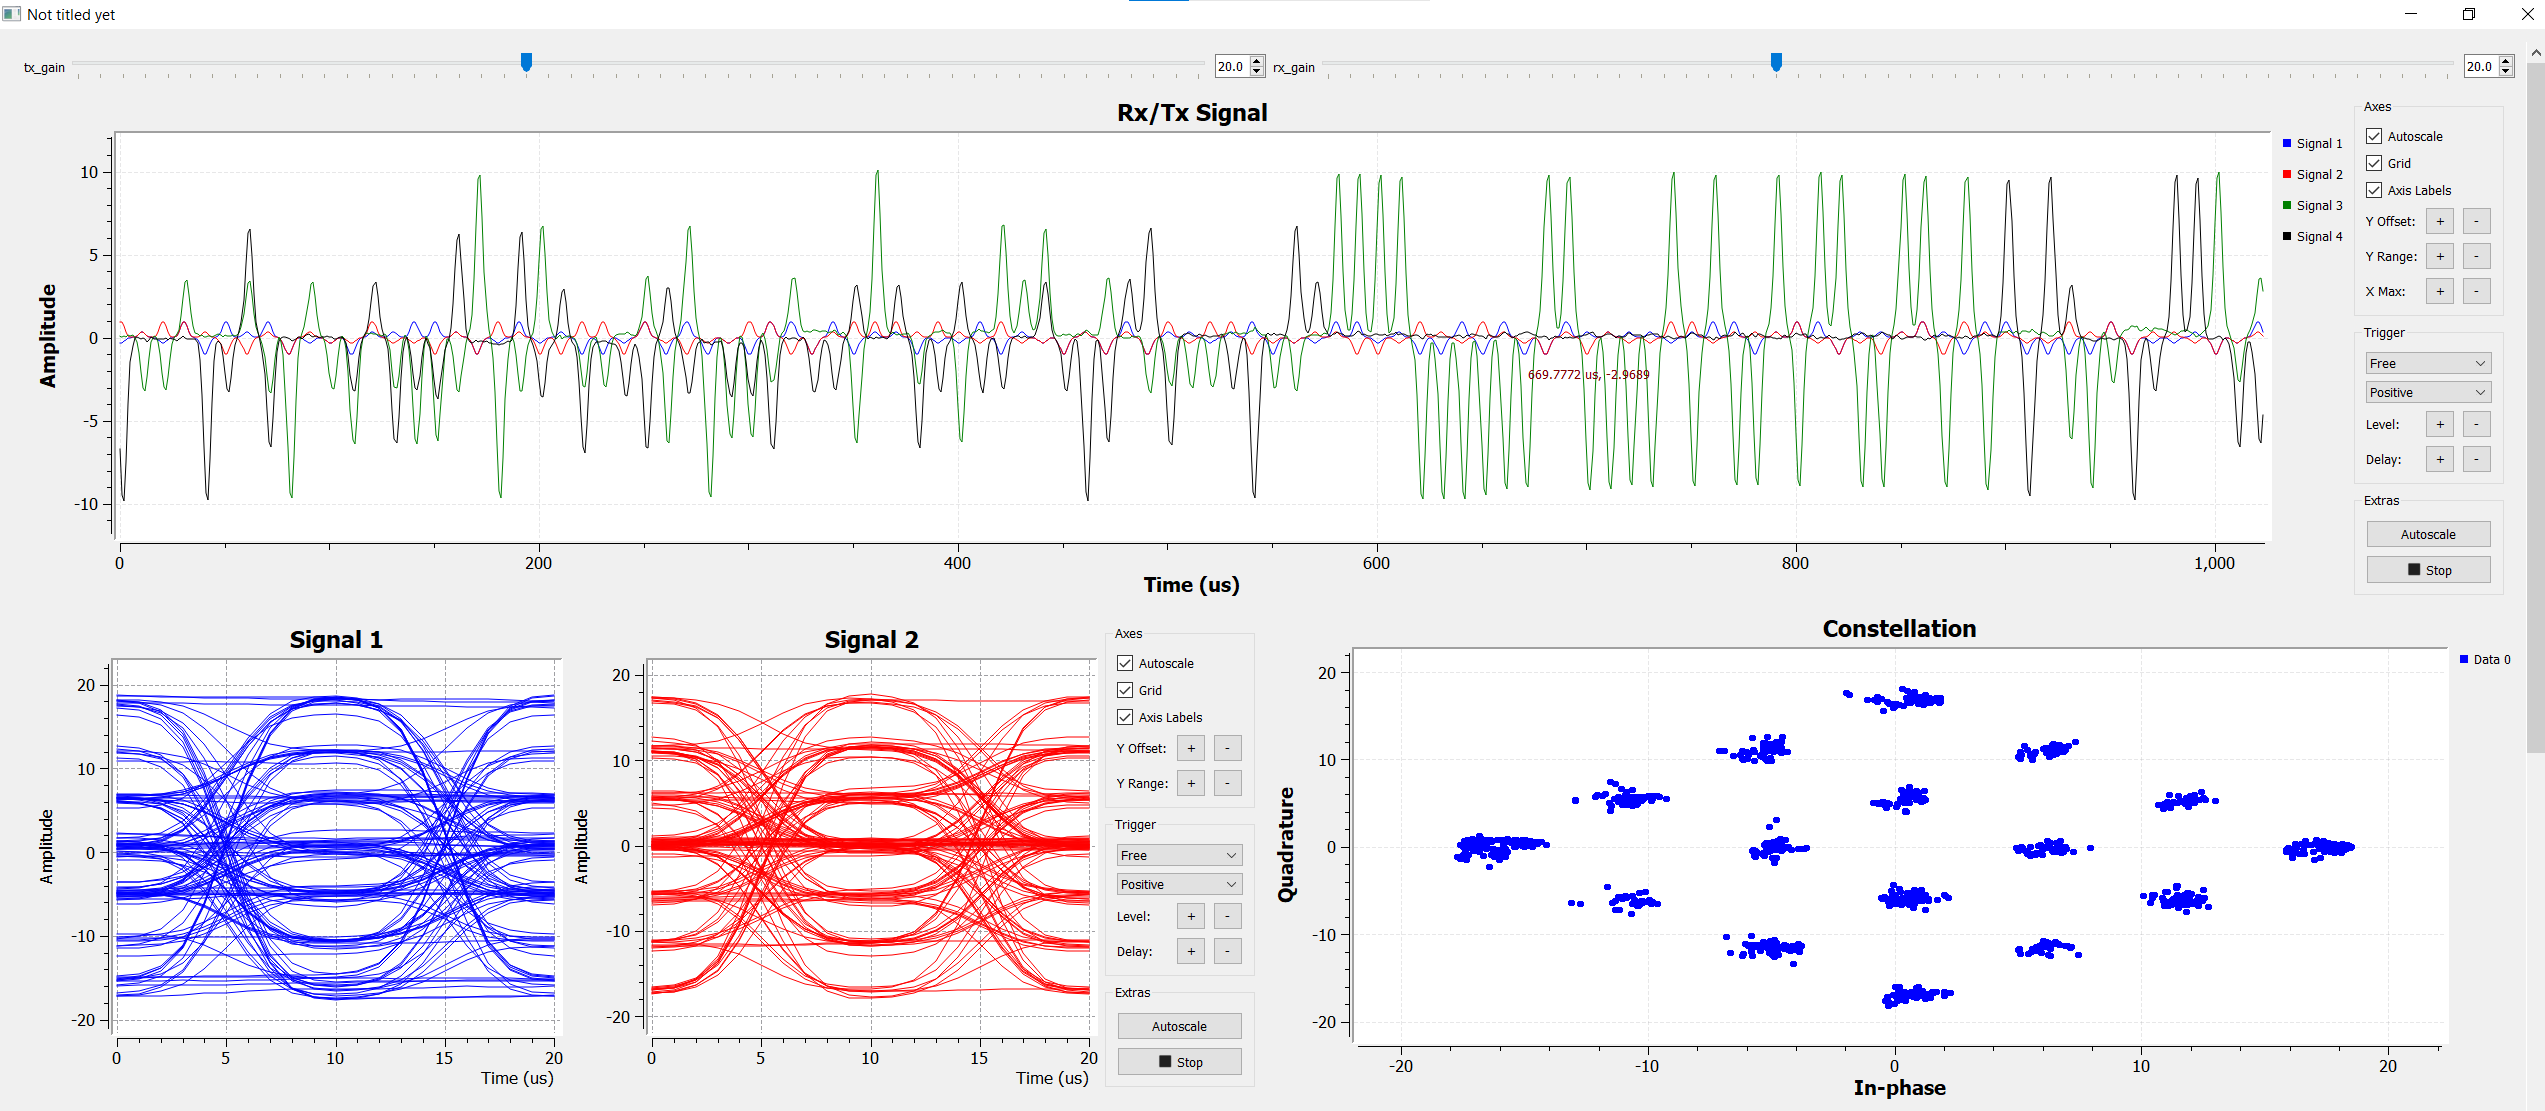
After reverting to a rectangular pulse shape, proper synchronization was successfully achieved. The figure below displays the synchronized signal, which was captured over a channel with some noise.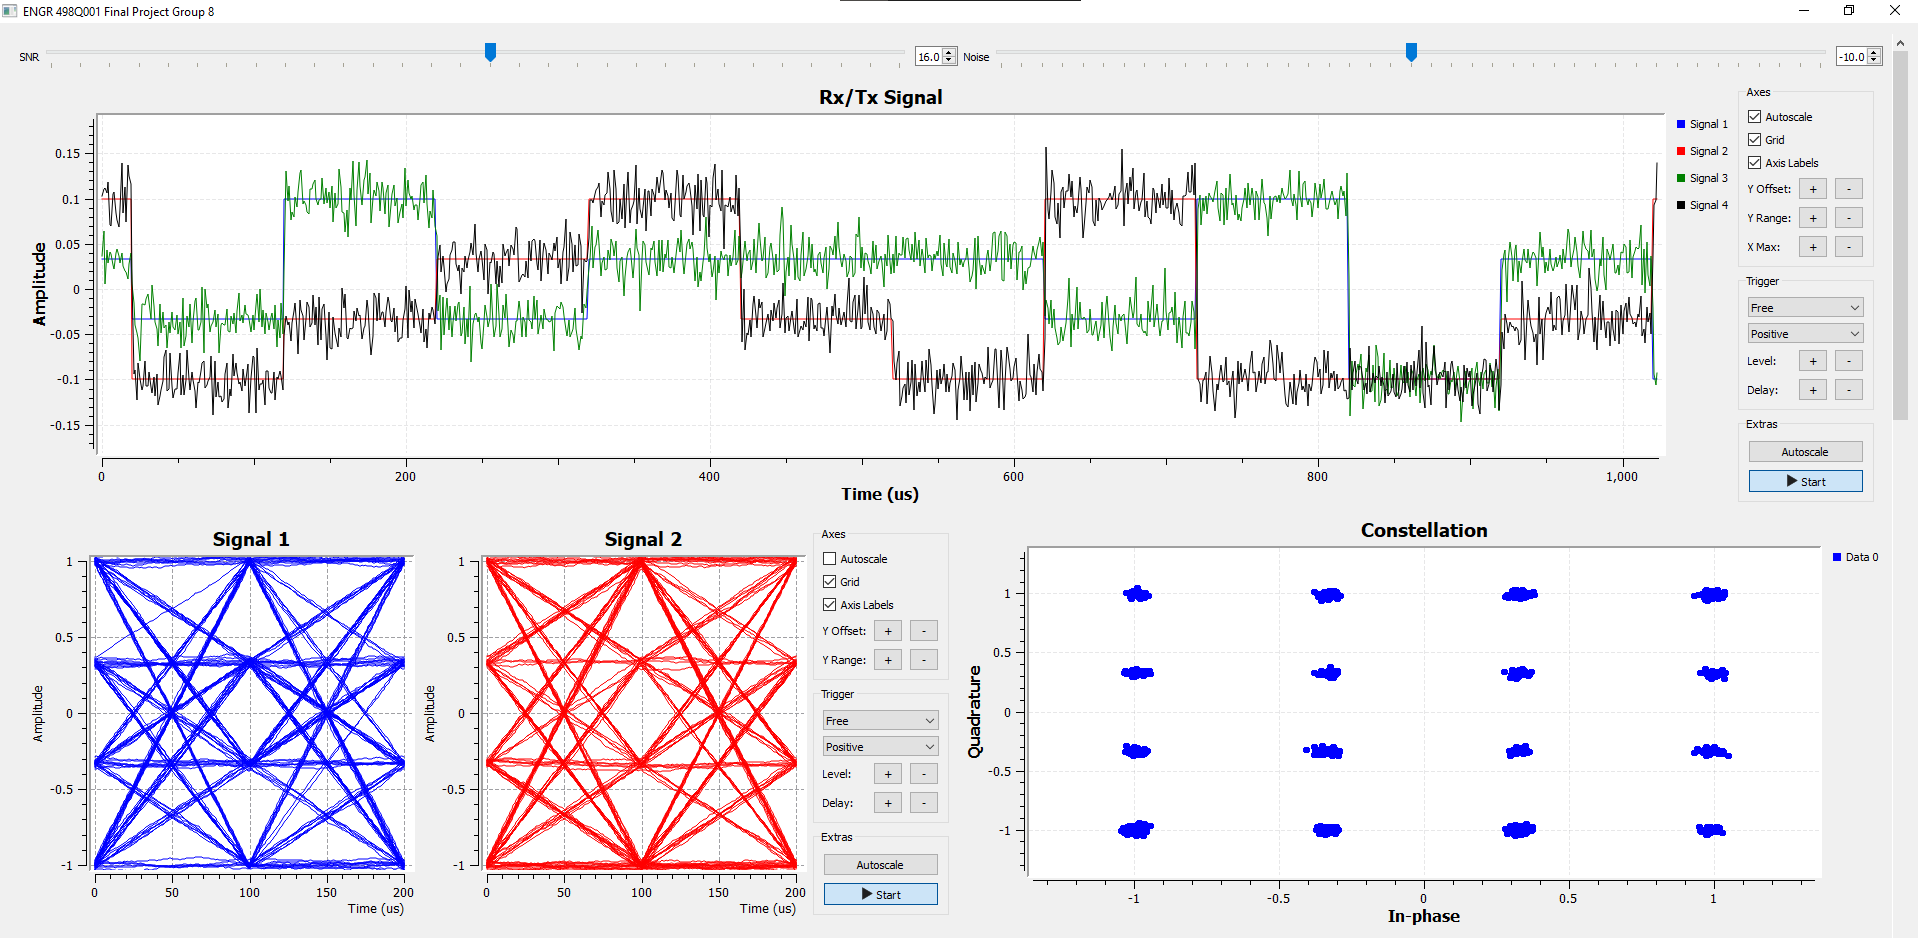
Increasing the channel's noise causes the eye diagram to close, but the synchronization remains stable.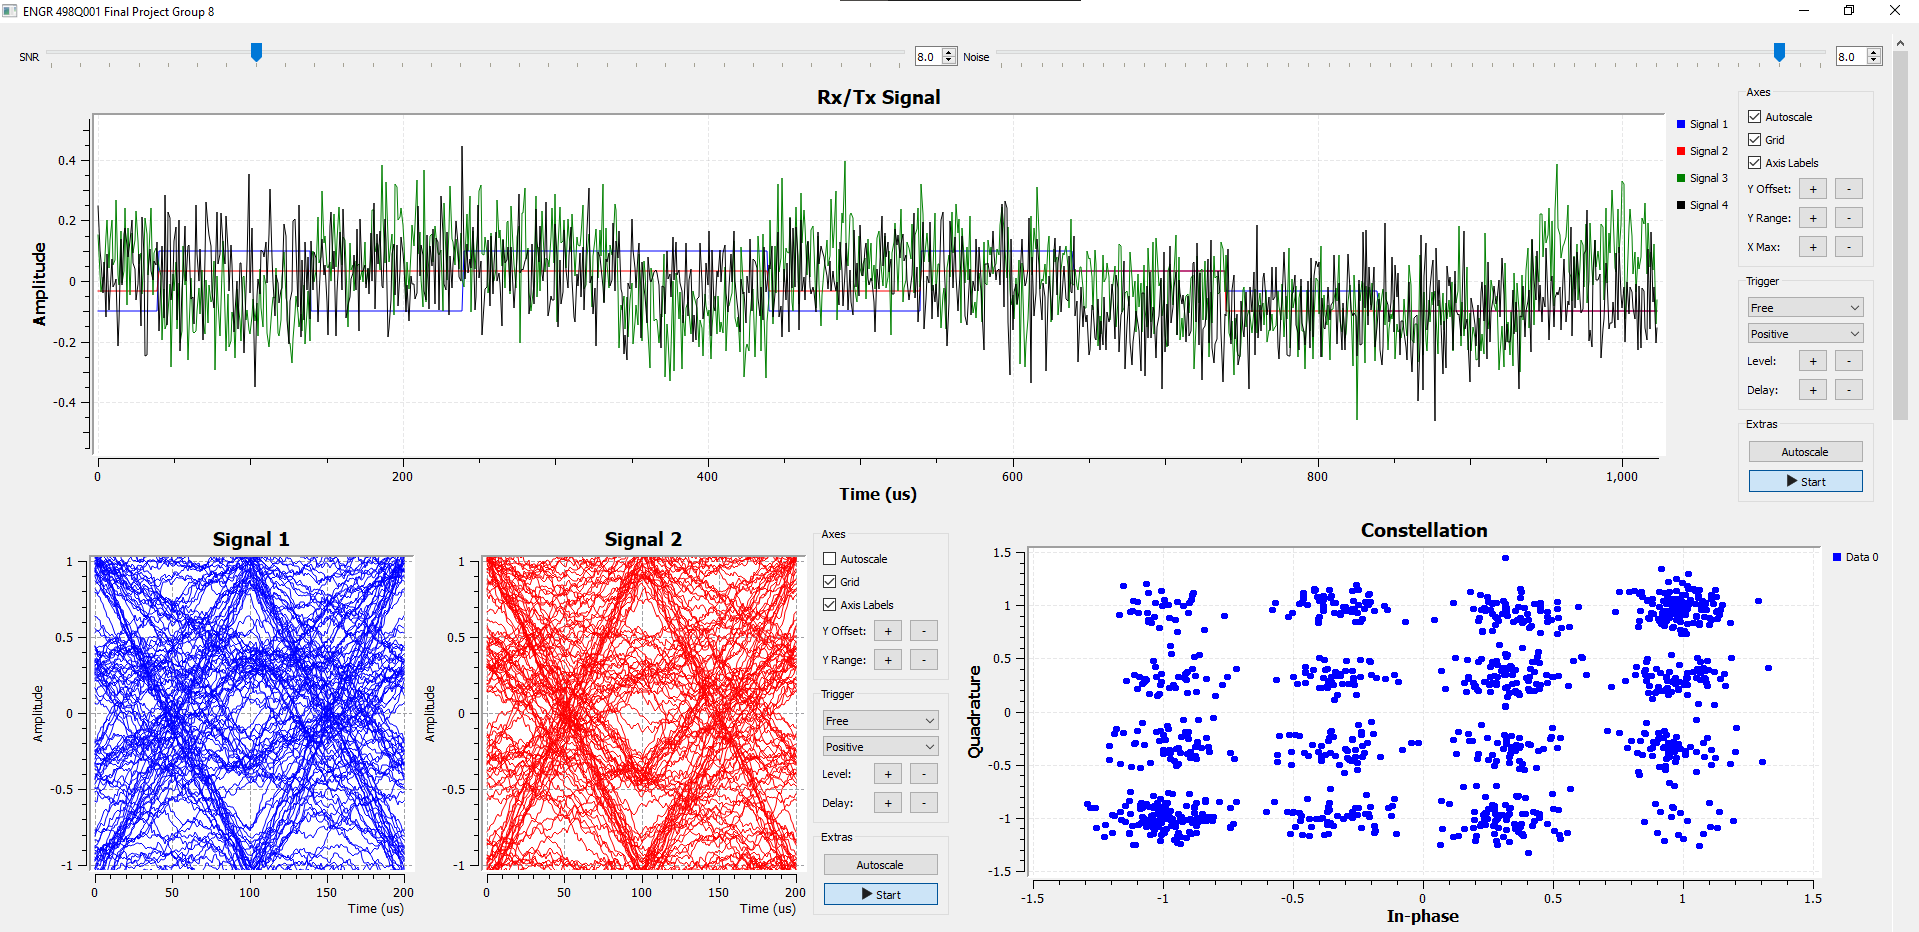
Reception, Frame Syncronization and Decoding
Once the incoming QAM signal is synchronized to the receiver's local oscillator, it must be downsampled to isolate the actual data symbols. Up to this point, the signal is heavily oversampled to accommodate pulse shaping. To strip away these transition samples, the signal is routed through a Keep 1 in N block. By selecting only the peak sample of each symbol period and discarding the rest, this block decimates the stream down to exactly one sample per symbol.
This downsampled symbol stream is then fed into a custom Frame_Sync Python block alongside the output of a dedicated pilot correlator filter. The pilot correlator utilizes an FIR filter to cross-correlate the incoming data with the known 32-symbol pilot sequence. When the pilot passes through, it generates a distinct spike which the Frame_Sync block uses as a precise timing reference. By calculating this exact delay, the block shifts the one-sample-per-symbol stream into perfect alignment, allowing the synchronized data to be cleanly passed to the virtual sink for final 16-QAM decoding and Symbol Error Rate (SER) calculation.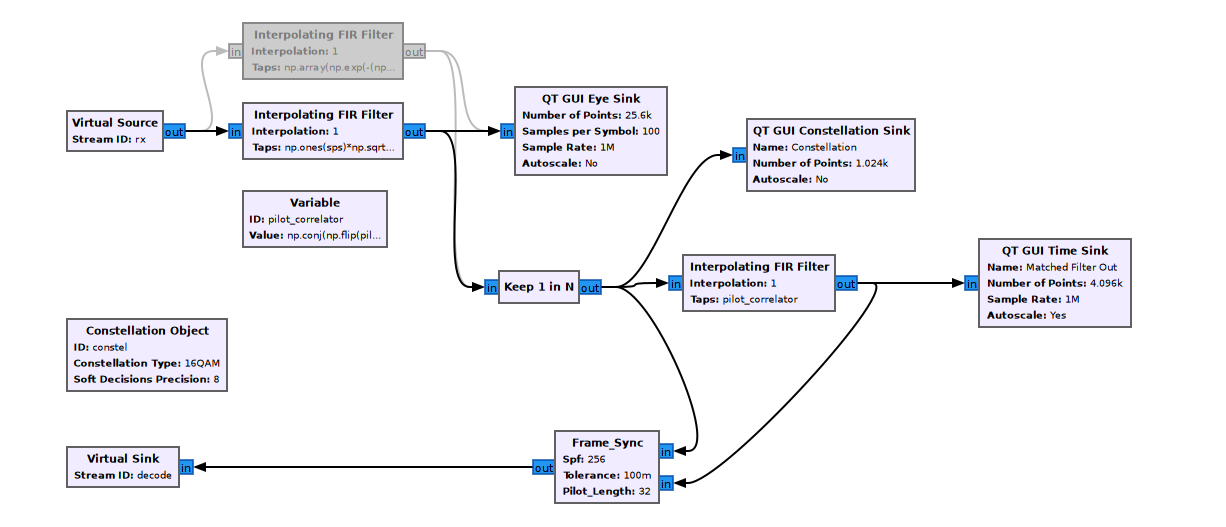
The figure below displays the receiver performance using a rectangular pulse shape in a noisy channel. Here, we can clearly observe the received correlation spike, the matched filter output, and the successfully recovered symbols.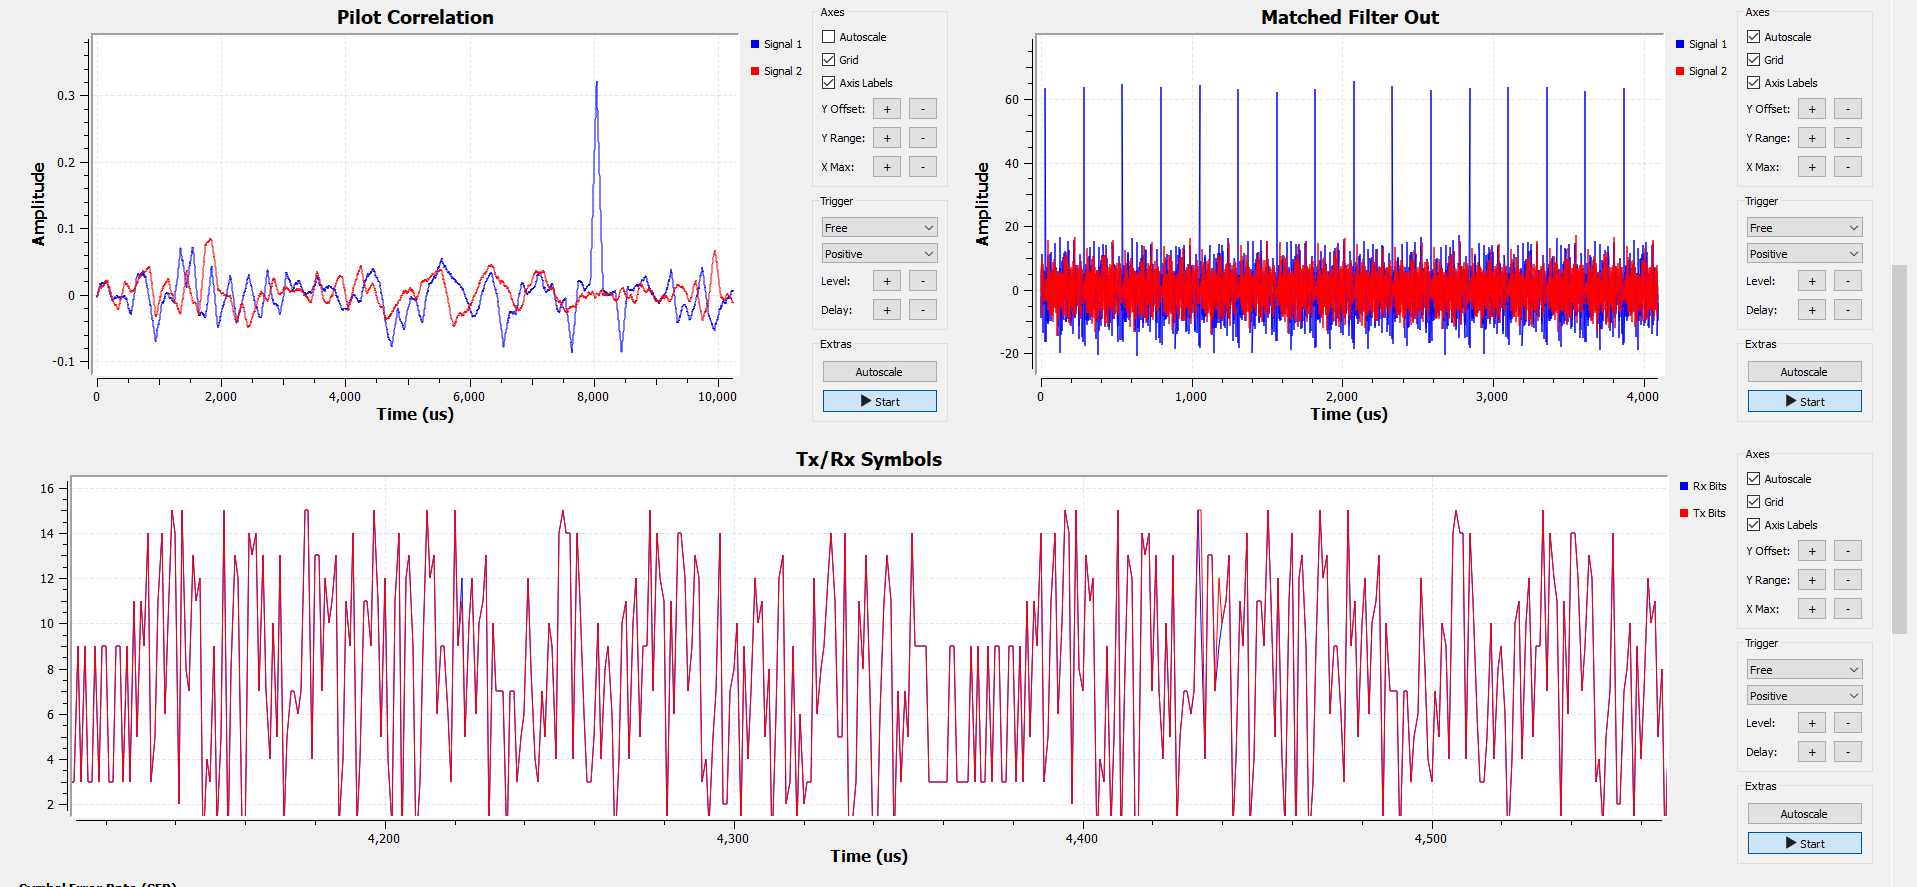
Decoding and Error
To quantify the systems performance under various noise conditions, the synchronized received symbols (decode) and the original transmitted symbols (tx_symbols) are both decoded into data characters and subtracted from one another. Any non-zero difference indicates a bit mismatch and triggers an error flag. A moving average block then tracks these flags over a 100k-sample window, calculating a real-time Symbol Error Rate (SER) for the system.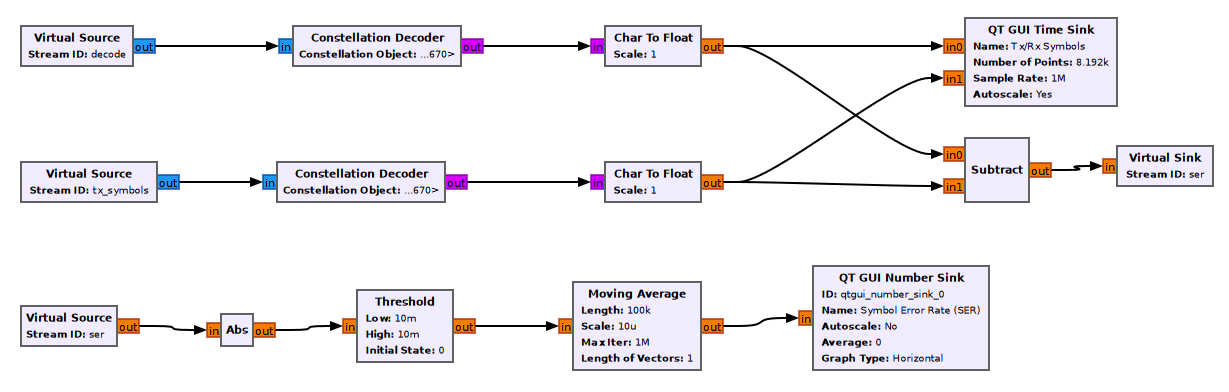
Statistical and power analysis of the decoded data is handled by isolating the signal's quadrature component via a Complex to Imag block. The raw imaginary values are fed directly into a histogram sink to visually analyze noise distribution and cluster density across the constellation rows. Simultaneously, the signal is squared to compute its instantaneous power, which is smoothed through a moving average filter to track the stable average Received Energy.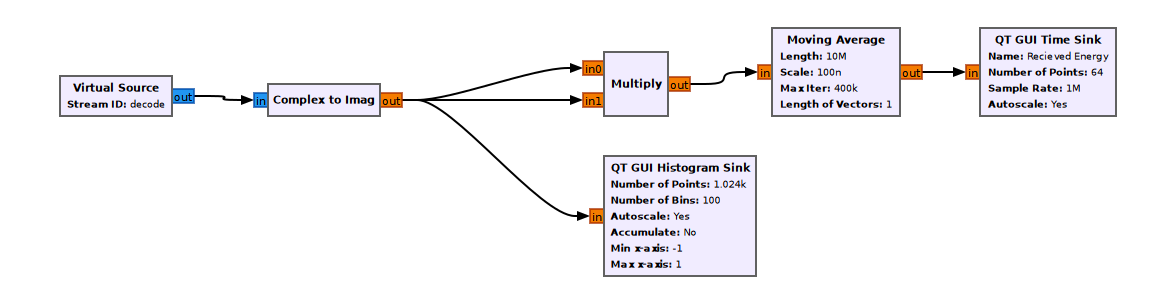
Under very low noise conditions, the system achieves a perfect SER of 0, as shown below.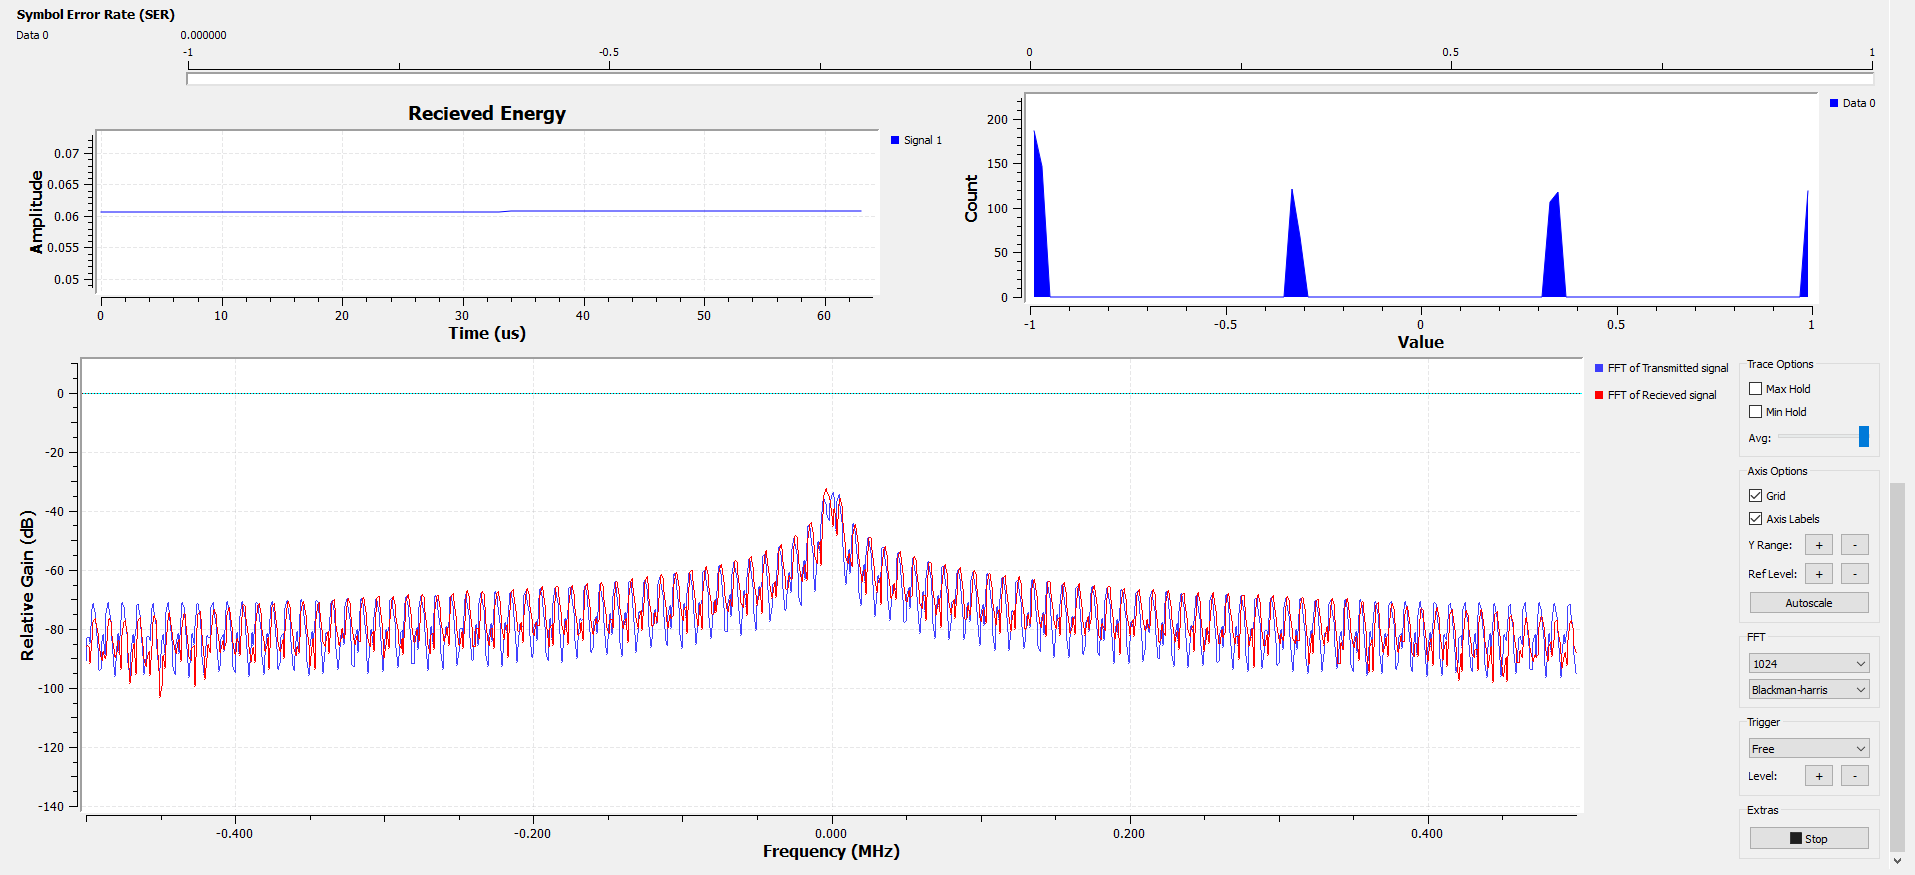
Increasing the channel's noise causes the SER to rise to 0.00634, the histogram to widen, and the average power to increase.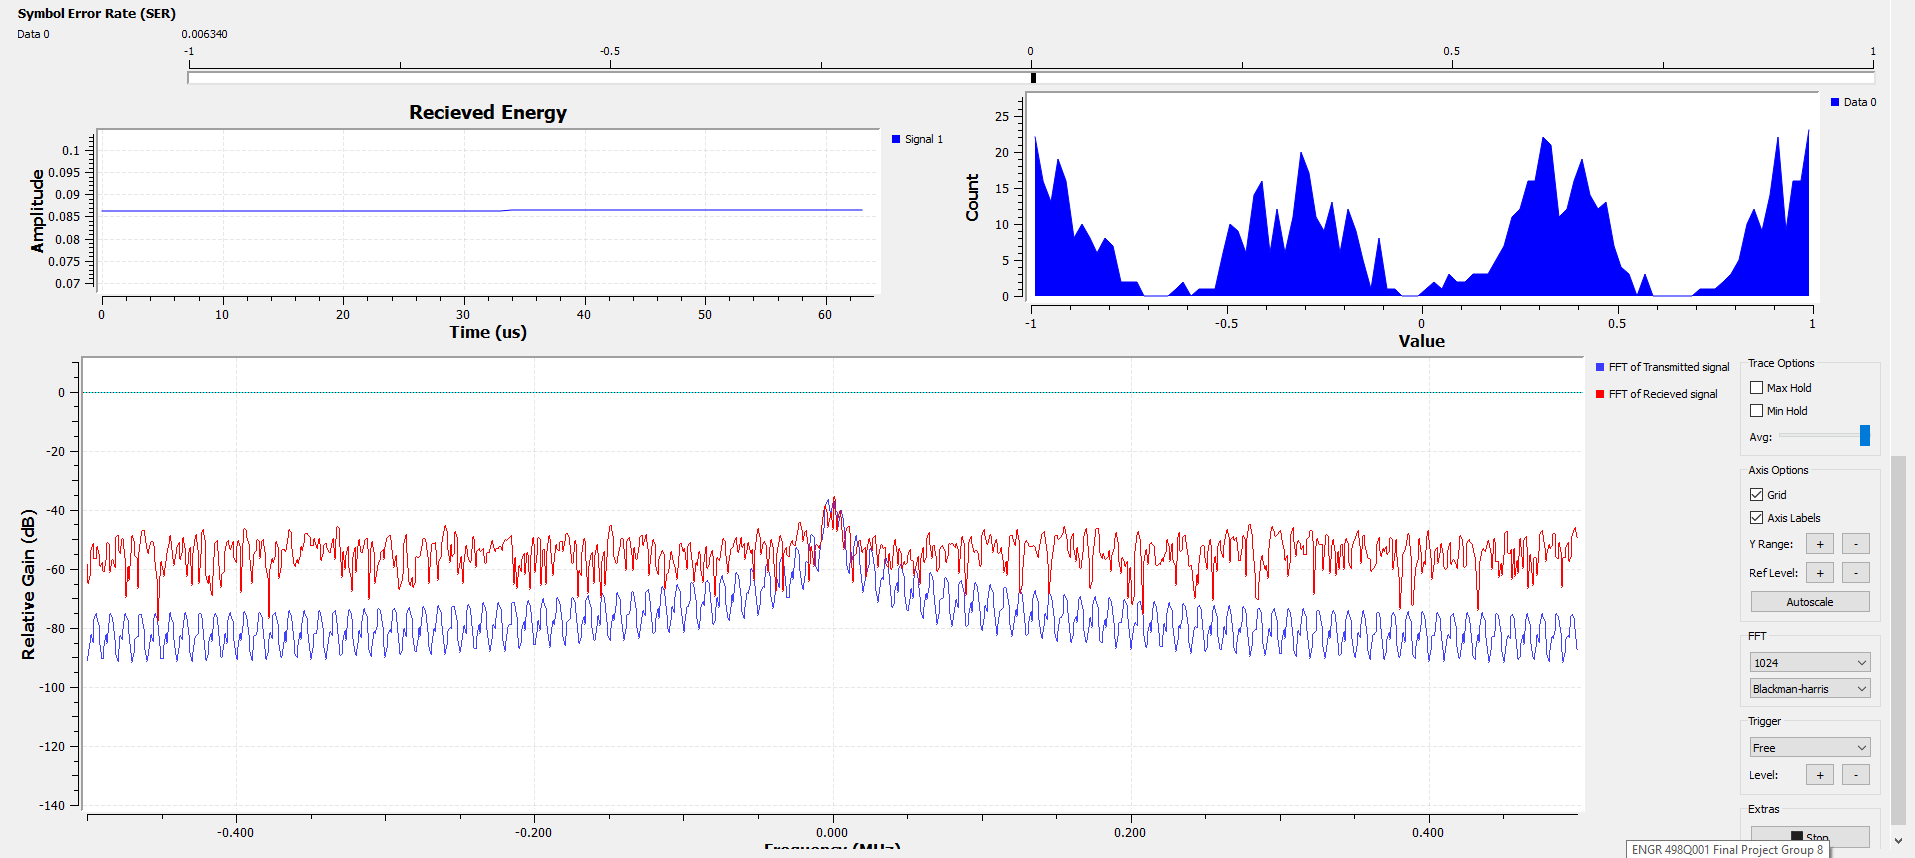
Results
Overall, the project successfully achieved its core objectives despite a few critical implementation hurdles. The primary challenge was that our Python phase synchronization block could not accommodate a Gaussian pulse-shaped signal, which restricted our ability to optimize bandwidth usage and harmonics. However, by troubleshooting with a rectangular pulse shape, we proved the robustness of the rest of the receiver pipeline, achieving perfect frame synchronization and accurate symbol decoding under varying noise conditions.
Video of System
Below is a demonstration video of the 16-QAM system operating over a virtual channel, where noise is added and removed.